
Beyond CO-PO Mapping: How to Analyze Program Articulation Metrics in OBE
By Studium Tech Pvt Ltd · 8 Aug 2026 · 18 views
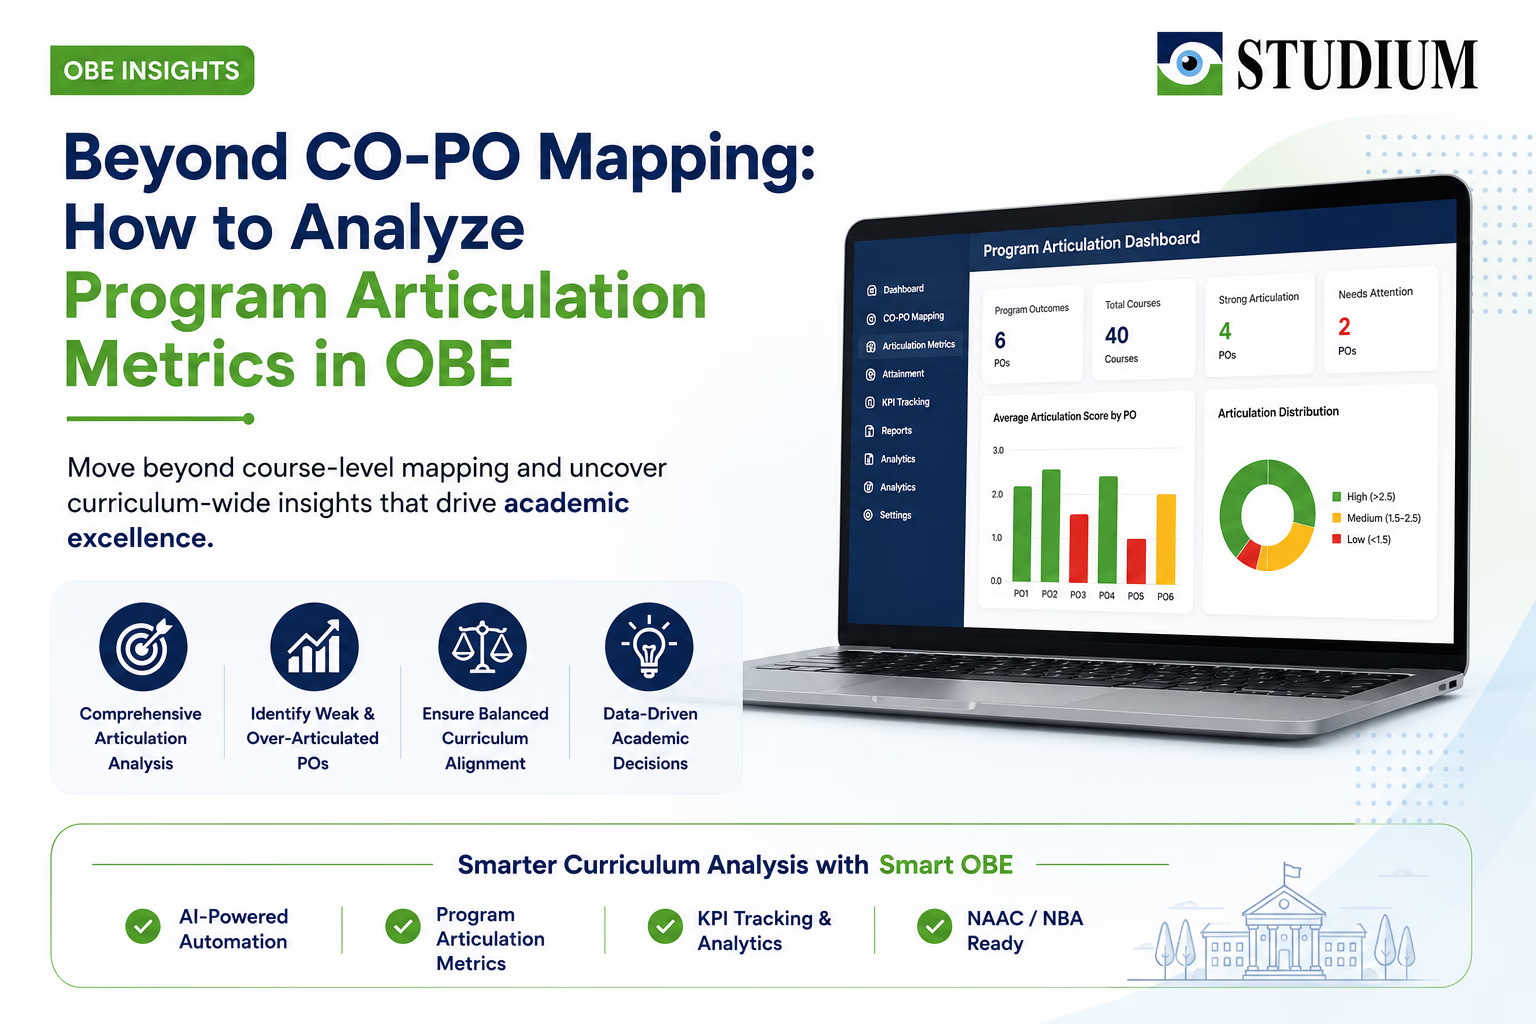
Program Articulation Metrics
Program articulation metrics help institutions understand:
- How the curriculum is actually structured
- Which Program Outcomes are strongly supported
- Which Program Outcomes are neglected
- Whether the curriculum is academically balanced
- Whether the program is aligned with institutional intent
In simple words:
CO-PO mapping analyzes individual courses.
Whereas:
Program articulation metrics analyze the curriculum as a complete academic ecosystem.
This makes articulation metrics one of the most important tools for:
- IQAC teams
- Program coordinators
- Curriculum committees
- Accreditation readiness
In this blog, we will continue the same MBA example used in the CO-PO mapping workbook and understand:
- How articulation metrics are created
- How to read them
- How to identify red flags
- How institutions should use them for academic improvement.
This is also one of the core intelligence layers used inside Studium’s Smart OBE framework.
What are Program Articulation Metrics?
Program articulation metrics are curriculum-level analytics that summarize:
“How strongly does the complete program support each Program Outcome?”
Instead of analyzing one course at a time, articulation metrics evaluate:
- All courses together
- Their contribution to Program Outcomes
- The balance of curriculum articulation
Why CO-PO Mapping Alone is Not Enough
A single course may have:
- good COs
- Proper Bloom’s alignment
- Strong mapping values.
However, at the overall curriculum level:
- Some Program Outcomes may receive very little support
- Some may be excessively mapped
- Some may receive only weak articulation.
This creates major academic problems.
For example:
- Analytical thinking may dominate the curriculum
- While ethics or communication outcomes may remain weak.
Similarly:
- Too many courses may weakly map to one Program Outcome
- Creating artificial articulation without meaningful learning depth.
This is why institutions must move beyond individual CO-PO matrices and analyze:
Program-wide articulation patterns.
Continuing the MBA Example
Let us continue the same MBA example from the previous workbook.
Assumption:
- MBA program has 40 total courses across all semesters.
- All courses are mapped to the official AICTE MBA Program Outcomes.
Now imagine that every course has already completed:
- CO framing, competency analysis
- Bloom’s taxonomy alignment
- CO-PO mapping.
The next step is to consolidate this intelligence at the program level.
Step 1: Calculate Average Mapping for Each Course
In the previous CO-PO mapping framework, we calculated:
Horizontal Average
This represented:
“On average, how strongly does this course map to a Program Outcome?”
For example:
| Course | PO1 | PO2 | PO3 | PO4 | PO5 | PO6 |
|---|---|---|---|---|---|---|
| Marketing Strategies | 1.5 | 2.4 | 0.5 | 2.7 | 1.0 | 2.0 |
This tells us:
- 1.5 Marketing Strategies strongly contributes to:
- PO2 (Analytical Thinking)
- PO4 (Problem Solving)
Whereas:
- contribution to PO3 and PO5 is weak.
This is not necessarily wrong.
In fact, this is academically healthy because:
- not every course should contribute equally to every Program Outcome.
Step 2: Build Program Articulation Matrix
Now imagine that we perform this analysis for all 40 MBA courses.
The articulation matrix now becomes:
| Program Outcome | Number of Courses Mapped | Average Mapping Score |
|---|---|---|
| PO1 | 28 | 1.9 |
| PO2 | 35 | 2.6 |
| PO3 | 14 | 1.4 |
| PO4 | 31 | 2.5 |
| PO5 | 12 | 1.3 |
| PO6 | 22 | 2.0 |
This becomes the central articulation intelligence layer.
What Does This Matrix Tell Us?
This matrix gives institutions multiple strategic insights.
Insight 1: Which Program Outcomes Have Least Number of Courses?
Example:
- PO5 → only 12 courses mapped
This may indicate:
- ethics-related learning is underrepresented
- curriculum articulation for ethics is weak
- faculty are unable to identify ethical competencies properly.
This becomes a major discussion point for:
- IQAC teams
- curriculum committees
- program coordinators
Insight 2: Which Program Outcomes Have Excessive Mapping?
Example:
- PO2 → 35 courses mapped
At first glance, this may look positive.
However, excessive mapping often creates another problem:
Over-articulation.
This may indicate:
- faculty are mapping too many courses generically
- analytical thinking is becoming an overused Program Outcome
- or the curriculum is losing specialization.
This needs careful review.
Insight 3: Average Mapping Strength
The second layer of intelligence is:
What is the average articulation score?
This tells institutions:
- whether mappings are actually meaningful
- merely compliance-driven.
Example Red Flag Scenario
Imagine:
| Program Outcome | Courses Mapped | Avg. Score |
|---|---|---|
| PO2 | 38 | 1.2 |
This means:
- many courses claim alignment with PO2
- but the mapping strength is weak.
This usually indicates:
- generic PO writing
- random mapping
- poor competency alignment.
This is one of the strongest red flags in OBE implementation.
Color Coding Framework for Program Articulation Metrics
To simplify interpretation, institutions should color-code articulation scores.
| Average Score | Interpretation | Suggested Color |
|---|---|---|
| Below 1.5 | Weak Articulation | Red |
| 1.5 – 2.5 | Good Articulation | Yellow |
| Above 2.5 | Very Strong Articulation | Green |
Important Academic Insight
Both extremes require investigation.
Extremely Low Scores
May indicate:
- weak curriculum alignment
- poorly written COs
- neglected Program Outcomes
Extremely High Scores Everywhere
May indicate:
- dense mapping philosophy
- artificial articulation
- lack of curriculum focus.
A healthy curriculum should show:
- meaningful distribution
- focused articulation
- balanced academic intent.
Understanding Curriculum Balance
One of the biggest advantages of program articulation metrics is that institutions can now understand:
“What is our curriculum actually trying to achieve?”
For example:
If:
- most courses strongly articulate analytical thinking
- communication and ethics remain weak
then the institution may unintentionally produce:
- technically strong graduates
- but weak communicators or ethically unprepared professionals.
This transforms OBE from: documentation into curriculum intelligence.
What Should Faculty Members Analyze?
Faculty members should evaluate:
- whether their course has clear focus
- whether the mapping is academically justified
- whether competencies are correctly represented.
Faculty should avoid:
- mapping every CO with every PO
- generic articulation
- compliance-based inflation.
What Should Program Co-ordinators Analyze?
Program coordinators should evaluate:
- distribution of articulation across the curriculum
- dominance of certain Program Outcomes
- underrepresented Program Outcomes
- overlap between courses.
They should ask:
“Is our curriculum academically balanced?”
What Should IQAC Teams Analyze?
IQAC teams should discuss articulation metrics deeply during academic review meetings.
The discussion should include:
- Why are some Program Outcomes weak?
- Why are some over-articulated?
- Are courses properly focused?
- Are competencies correctly distributed?
- Is the curriculum aligned with institutional vision?
IQAC should ensure that:
- articulation metrics are periodically reviewed
- corrective actions are implemented
- curriculum improvements are documented.
Program Articulation Metrics as a Continuous Improvement Tool
One of the biggest misconceptions in OBE is that CO-PO mapping is a one-time exercise.
In reality: articulation metrics should continuously evolve.
Whenever institutions:
- redesign curriculum
- add electives
- change pedagogy
- revise Program Outcomes
- articulation patterns also change.
This is why articulation metrics should become a part of: • • • annual academic reviews, IQAC discussions, and curriculum redesign processes.
How AI is Transforming Program Articulation Analysis
Traditionally, articulation analysis is:
- spreadsheet-heavy
- manual
- difficult to interpret.
Modern AI-powered OBE systems can now:
- identify articulation gaps
- detect over-mapping
- generate curriculum insights
- analyze competency balance
- recommend corrective actions.
This significantly improves:
- curriculum intelligence
- academic governance
- accreditation preparedness.
Smart OBE and Program Articulation Metrics
Studium’s Smart OBE framework automatically generates articulation metrics from CO-PO mapping data.
The platform helps institutions:
- visualize articulation patterns
- identify weak and over-articulated Program Outcomes
- track curriculum balance
- support IQAC-led academic reviews.
The goal is not merely to automate reporting.
The goal is to help institutions build:
- smarter curriculum systems
- stronger academic alignment
- meaningful outcome-based learning.
Final Thoughts
Program articulation metrics represent one of the most advanced and meaningful layers of Outcome-Based Education.
They help institutions move beyond isolated course-level thinking and move towards curriculum-wide academic intelligence.
Institutions that regularly analyze articulation metrics are able to:
- improve curriculum quality
- strengthen Program Outcomes
- balance competencies
- create more focused learning ecosystems.
The future of OBE lies not only in attainment calculations
but in:
- intelligent curriculum articulation
- data-driven academic reviews
- AI-assisted academic governance.
0
Discussion
0 comments